
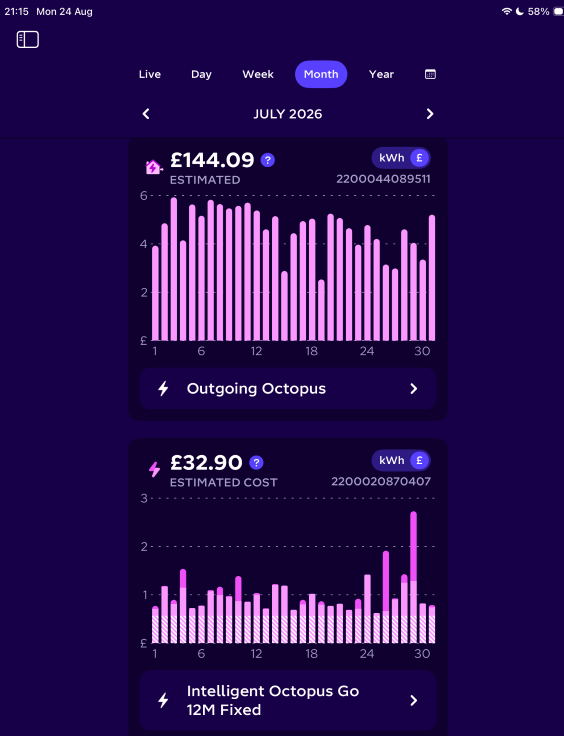
Octopus Energy Graph for the month of July showing 1200kWh surplus solar energy exported = £144.09. Lower graph shows 150kWh electricity consumed = £32.90. Stripy = standing charge, light pink = cheap rate.
Our results, updated daily
Whole-day totals from our solar inverter, smart meter and heat pump, published automatically from our Home Assistant system each morning.
Figures are daily totals for completed days. Self-sufficiency = share of the house's electricity not bought from the grid. COP = heat delivered ÷ electricity used (heating and hot water combined). Smart-meter figures can arrive a day or two late.
Energy bills = £1 per month
Before the retrofit, our direct debit to Octopus Energy was around £110–£115 a month for gas and electricity combined. Since the heat pump and solar went in, we’ve been able to reduce that to £1 a month — the statutory minimum — because the account is comfortably in credit and is likely to stay there.
Real numbers, not estimates
These are actual billed figures from our Octopus account, not projections:
| Billing period | Imported | Exported |
|---|---|---|
| 12 May – 11 Jun 2026 | 218 kWh (£31.49) | 857 kWh (£102.83 credit) |
| 12 Jun – 11 Jul 2026 | 175 kWh (£32.54) | 1,136 kWh (£136.26 credit) — our best month so far |
| 12 Jul – 11 Aug 2026 | 171 kWh (£33.95) | 1,100 kWh (£132.01 credit) |
By mid-August 2026 our Octopus account was £565 in credit, built up from solar export income plus two £50 Octopus referral rewards, against a direct debit of just £1/month.
The 12-month outlook
We’ve built a projection for the year ahead (September 2026 – August 2027), based on a seasonal model fitted to our actual billing data so far, rather than a rough guess:
- Projected import: ~3,780 kWh → about £619
- Projected export: ~7,744 kWh → about £929
- Net position: roughly £310 net credit for the year — export income is expected to exceed import cost even across a full winter
- Projected account balance in 12 months: around £875 in credit, assuming Octopus keeps collecting only the £1 minimum
Worth being honest about the uncertainty here: we don’t yet have a full winter of actual data with the new system running, so the winter months in this projection are modelled rather than measured, and Octopus will likely review and adjust our direct debit at some point as the credit balance moves. We’ll update these figures as real winter data comes in.
Will it still be in credit through winter?
That’s the question that actually matters — solar makes money in the summer when there is lots of sunshine and daylight. We built a realistic month-by-month projection for the year ahead, modelled from our own actual import/export data.
| Month | Import | Export | Net for month | Running account balance |
|---|---|---|---|---|
| Sep 2026 | 296 kWh | 841 kWh | £53 credit | £618 |
| Oct 2026 | 374 kWh | 636 kWh | £17 credit | £635 |
| Nov 2026 | 417 kWh | 389 kWh | £19 cost | £615 |
| Dec 2026 | 456 kWh | 242 kWh | £43 cost | £572 |
| Jan 2027 | 446 kWh | 191 kWh | £48 cost | £524 |
| Feb 2027 | 362 kWh | 244 kWh | £28 cost | £496 |
| Mar 2027 | 341 kWh | 435 kWh | £2 credit | £494 |
| Apr 2027 | 261 kWh | 652 kWh | £35 credit | £529 |
| May 2027 | 214 kWh | 902 kWh | £70 credit | £599 |
| Jun 2027 | 180 kWh | 1,036 kWh | £91 credit | £690 |
| Jul 2027 | 195 kWh | 1,124 kWh | £99 credit | £789 |
| Aug 2027 | 239 kWh | 1,052 kWh | £86 credit | £875 |
| 12-month total | 3,780 kWh | 7,744 kWh | £310 net credit | — |
The tariffs we’re on
- Import — Intelligent Octopus Go, a 12-month fixed tariff with a cheap overnight rate:
- Day rate 31.82p/kWh
- Night rate 7.62p/kWh 11:30pm – 5:30am
- standing charge 53.65p/day
- fixed until May 2027
- The battery and the car charger are both set to draw from the grid mainly during the cheap night window, so currently less than 10% of the electricity we consume is at the day rate.
- Export — Outgoing Octopus, a flat 12p/kWh for everything the panels send back to the grid, with no standing charge.
Switch to Octopus and you’ll get £50 credit, we get £50 too: share.octopus.energy/dawn-parrot-231
How we monitor the whole system
We use three apps day-to-day:
- mySigen — live and historical solar generation, battery charge level, and house import/export, from the Sigenergy inverter, battery and gateway
- MyVaillant heat pump control app — for the Vaillant/Heat Geek system’s smart thermostat and scheduling
- The Octopus Energy app — live tariff rates, half-hourly usage, billing history, and smart charging schedules for the car
Between the three, we can see almost everything the system is doing in real time — generation, storage, consumption, cost — from a phone. It helps that one of us has a technical background, but it isn’t a requirement: the system runs itself pretty much on autopilot without the need for much monitoring.